For any G8 currency, an engine explains why it's actually moving across every angle — primary driver, weighted driver breakdown, risk-sentiment regime, currency decomposition, retail positioning, scheduled catalysts, evidence checklist, what would invalidate it, plus macro, CB and trading context — each with a confidence score.
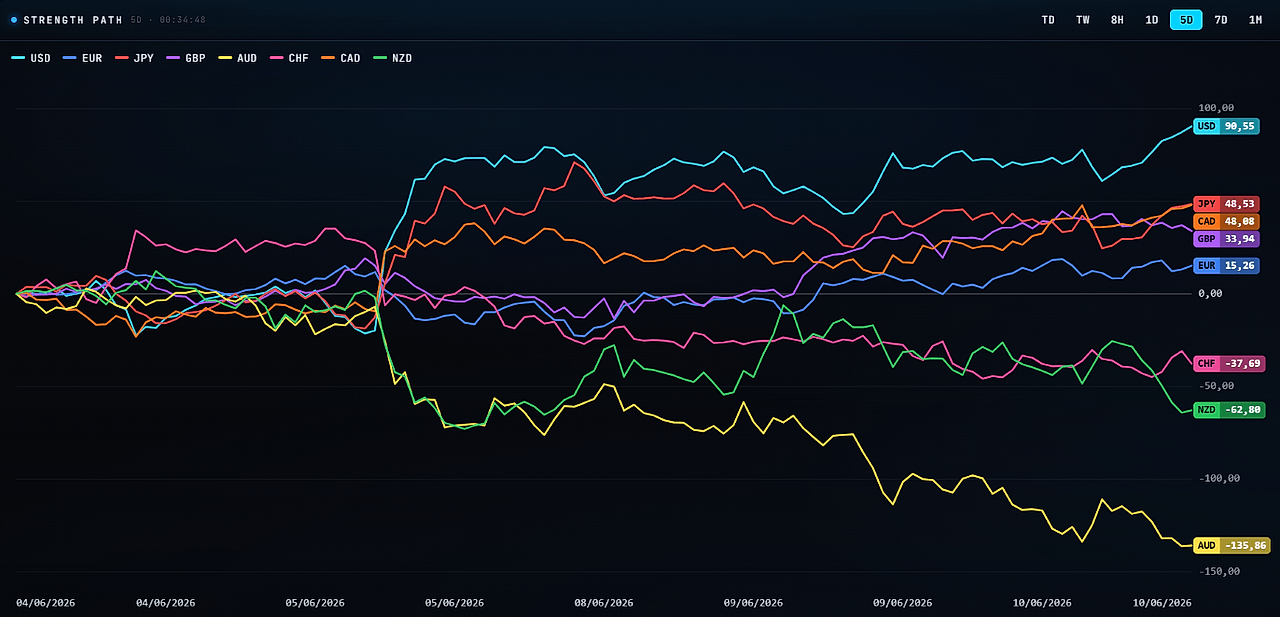
Primary Driver · USD · 5DAI INTERPRETATION
RISK-DRIVEN
The USD is higher over the past 5 days, driven primarily by risk-off sentiment and reinforced by hawkish Fed positioning and upside inflation surprises in PPI data.
PRIMARY DRIVERRisk-off regime supporting safe-haven USD demand
Hawkish Fed stance (5/5 tone score) maintaining restrictive policy bias
Hot PPI data (6.5% YoY vs 6.4% forecast, MoM 1.1% vs 0.7% forecast)
Elevated real yields providing yield support
Cross-asset risk aversion flows
Driver BreakdownESTIMATE
Risk-off sentiment35%
Risk regime score 1.88/5 with rising volatility directly supports USD via negative risk beta; this is the primary flow driver.
Central bank tone25%
Fed at maximum hawkish score (5/5) with persistent inflation concerns keeps rate expectations elevated.
Inflation surprise (PPI)20%
Headline PPI beat (6.5% vs 6.4%) and core ex-trade surged (0.8% vs 0.3% MoM) reinforcing sticky inflation narrative.
Yield/real-yield support12%
Positive real yield of 0.26% provides fundamental carry support.
Currency strength momentum8%
USD ranks #1 in strength despite modest reading of 43.81; move appears flow-driven rather than fundamental acceleration.
Risk Sentiment CheckREGIME FILTER
RISK-OFFscore 1.88/5CONFIRMS
ROLEPrimary driver of the move
IMPACTSupportive — risk-off flows favor safe-haven USD
The risk-off regime (driven by rising volatility) aligns with USD strength and confirms the macro backdrop of hawkish Fed and sticky inflation. This is not a contra-signal; risk sentiment and fundamentals are reinforcing each other.
Retail Positioning (Contrarian)CONFIRMED DATA
PAIREURUSD retail crowd
49.3% long50.7% short
CONTRARIANneutral USD · DECOMPOSITIONUSD · Medium strength